
Visual Data: How We Receive and Interpret GPR Data
Ground penetrating radar data is one of the more complex aspects of the locating process from an outside perspective. The data appears to be simple waves across a screen, resembling the appearance of TV static or some kind of wavy art. How does this help us determine the existence of subsurface utilities and other structures? It’s surprisingly simple, even from outside the technical perspective. To understand this data, we’ll have to take a look at the tools we use in order to gather data first.
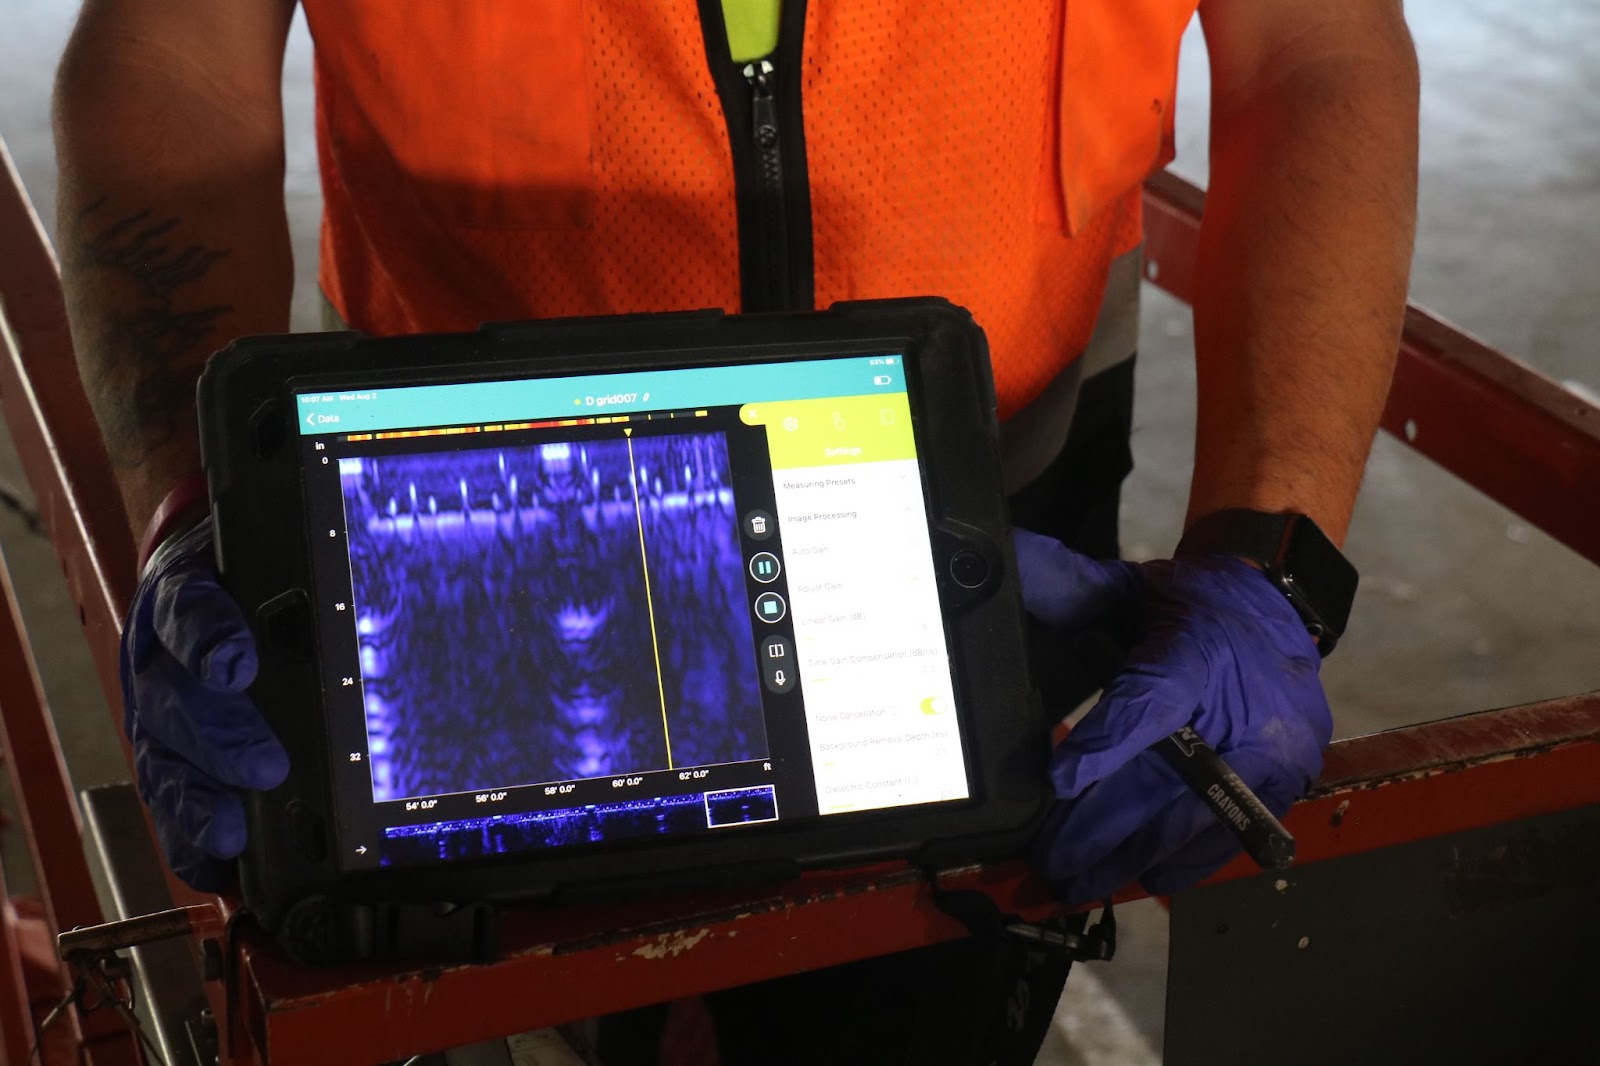
Ground penetrating radar devices emit signals similar to that of a microwave, which acts similarly to ground penetrating radar in that it produces electromagnetic waves that travel through and reflect off materials. Ground penetrating radar systems transmit higher-frequency electromagnetic waves (radiowaves) off of conductive materials in a cone-like shape, which are then reflected back into the device’s receiver for readable hyperbolic data. These hyperbolic reflections are the key to locating utilities and other subsurface features, usually producing either a positive or negative reflection off of subsurface structures. It even reflects off the surface. A positive reflection consists of a lighter band of color over a darker band of color. A negative reflection consists of a darker band of color over a lighter band of color. Ground penetrating radar provides a cross section of the scanned area, which can change the wavelength depending on the antenna within the GPR unit. In most cases, this accuracy does not get finer than an inch of distance, which is why you should avoid working around marked utilities within a foot and a half of space if possible, or use soft digs to determine the exact depth and position of utilities for congested areas.
A metal utility will typically produce a positive reflection that can easily be read by ground penetrating radar. These waves usually appear to show prominent differences between different physical material compositions. This can result in GPR showcasing changes such as soil layers or the bottom of a concrete slab. A good example of this can be seen with voids under the surface, where a water filled void will produce a positive reflection and an air filled void produces a negative reflection. Inactive PVC pipes are notably harder to locate compared to more metallic structures since the transmitted waves speed up through the pipe and produce a negative reflection with less amplitude by comparison. This is where a tracer wire is used if there's an available access point to push it into the pipe. By pushing a fiberglass coated copper wire into a utility pipe, you can trace the wire easier.
Soils and their physical make-up can also affect how these waves are reflected, with dry, sandy soil being the most ideal conditions for scanning. These conditions provide the best possible depth with less signal falling off as it penetrates the earth (known as natural absorption). Wet conditions are less ideal, polarizing the signal and making it harder to examine the wave lengths off of subsurface structures. Electronic interference can also have an effect on readings: cell phones, radios, televisions, microwaves, wireless internet and GPR devices all use relatively similar wavelengths in their operations, creating a noise of wavelengths that can cause interference. Cell phone interference can be especially notable considering the widespread usage of phones. Orientation can also affect how utilities appear on a scan. Scanning perpendicular to the utility line results in a more clear appearance, and any bends outward from the parabolic appearance on a 2D scan usually would signify a bend in the utility. Of course, 3D models can also be made using GPR data with a controlled scan.
Having an idea of what’s underneath beforehand can help with the locating process as you know what tools you’ll need to assist in this process. At the end of the day, ground penetrating radar readings are somewhat subjective, and a single reflection of data may not tell you what type of utility line you’re dealing with. Utilities and structures may appear differently depending on how long they’ve been underground and the material they’re made of. Voids may not be immediately visible, but the pooling of soil into a single point may show the formation of a void. This is where other tools come in handy, such as electromagnetic locators to verify signals and split boxes to locate metal objects. Surface features are also helpful in interpreting data, allowing us to understand what kinds of utilities need to be located. Vacuum excavation can provide for a further understanding of where utilities overlap within close proximity on GPR readings.
Locating is both understanding the data and understanding physical space at the same time. Our team here at Trinity Subsurface is knowledgeable in determining what kinds of utilities are under the surface of your next project. Through various technologies and methods, we can help determine their locations. Check out the rest of our website for more information on utility locating and the scanning process.


